
- Plan
- Explore
- Concept
- Evaluate
- Launch
Journey Mapping
Overview
What is the user’s entire experience with a product or service, including the parts we didn’t design?
What is the user’s entire experience with a product or service, including the parts we didn’t design?
A journey map is a visualization of all the interactions, decisions, and emotional states a user moves through while accomplishing a goal with a product or service. Unlike a user flow or site map — which represent the system’s structure from a design perspective — a journey map is organized from the user’s perspective, and exposes where the designed experience fails to account for real-world context or where emotional friction accumulates across steps that individually seem fine.
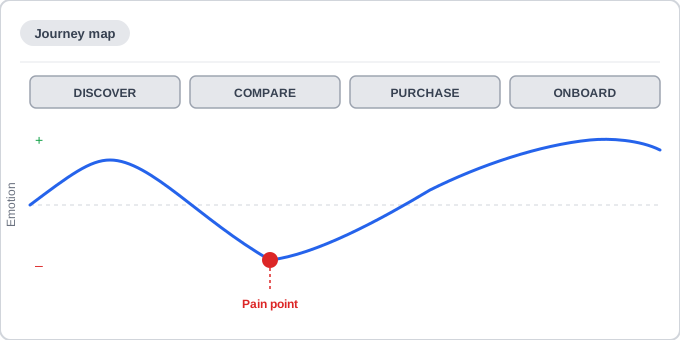 Same product, four phases — the curve shows where a real customer actually struggles.
What a journey map contains
Organized into phases that reflect the user’s own narrative arc (not the system’s architecture), a journey map documents for each phase:
- Actions: what the user does at each step
- Information and tools: what the user relies on — not just the product, but also phone calls, paper documents, other people
- Decisions: where choice points occur and what makes them difficult
- Emotions: the user’s feeling state, typically shown as a curve ranging from frustrated to satisfied
- Pain points: moments of friction, confusion, or failure
- Potential harms: risks or negative consequences the design could expose the user to
The output is typically a table with phases as columns and these dimensions as rows, producing a single artifact the whole team can read together.
When to use
Most valuable when:
- A problem spans multiple sessions, channels, or systems — not just a single screen or interaction
- The team needs emotional context alongside behavioral data, to understand why users abandon, not just where
- Different personas take meaningfully different paths to the same goal
- Before wireframing, to establish design principles from observed experience rather than assumptions
A journey map built from stakeholder assumptions is a guess, not a map. Journey maps should be built from (or validated by) data collected through customer research — interviews, observation, or usability sessions — not internal workshops alone.
A journey map built from stakeholder assumptions is a guess, not a map.
Journey maps vs. service blueprints
A journey map shows experience from the user’s perspective. A service blueprint shows the same journey from an operational perspective: the backstage processes, staff actions, and systems that support each user-facing step, aligned horizontally with the user journey above them.
Both tools are complementary. The journey map reveals where users struggle; the service blueprint reveals why — which backstage process or system handoff is failing them. Neither replaces the other.
The journey map reveals where users struggle; the service blueprint reveals why — which backstage process or system handoff is failing them.
The service blueprint comes from Service Design, a broader discipline concerned with an entire service’s people, infrastructure, and delivery process, not just its user-facing interface.
Relationship to other methods
Journey maps sit between research and design in the process:
- Customer Research Methods, Contextual Inquiry, and Task Analysis generate the raw data — what users do, in what context, with what tools.
- The journey map synthesizes that data into a phase-organized visualization the whole team can read.
- Personas and Scenarios situate the journey in a specific user context — a scenario provides the narrative, a journey map provides the structured breakdown of that narrative.
- Rapid Prototyping follows: the journey map shows where pain points concentrate, which drives what to prototype and test first.
The connection to Seven Stages of Action is also direct: a journey map shows which phases of the action cycle are producing a gulf of execution (user can’t figure out how to proceed) or a gulf of evaluation (user can’t tell whether they’ve succeeded). Making those gulfs visible across a multi-step journey is something the action cycle’s per-action framing doesn’t capture on its own.
Related Concepts
Principles
Processes
- Customer Research Methods
- Personas and Scenarios
- Task Analysis
- Contextual Inquiry
- Rapid Prototyping
- Service Design
Further reading
Nielsen Norman Group’s “Journey Mapping 101” (commercially published, no stated open license) draws a sharper three-way distinction this page doesn’t make — a journey map (one specific product and actor) versus an experience map (generic human behavior across an entire industry) versus a user-story map (feature planning, not discovery) — and recommends one map per actor to keep a map’s narrative coherent.
Sources
Research Collaboration and HCD Guide Series (Digital.gov) (Digital.gov/GSA, public domain) is this page’s sole source — the journey-map definition, the phase-organized actions/information/decisions/emotions/pain-points/potential-harms breakdown, the contrast with service blueprints, and the when-to-use guidance.