
Page Loading Speed
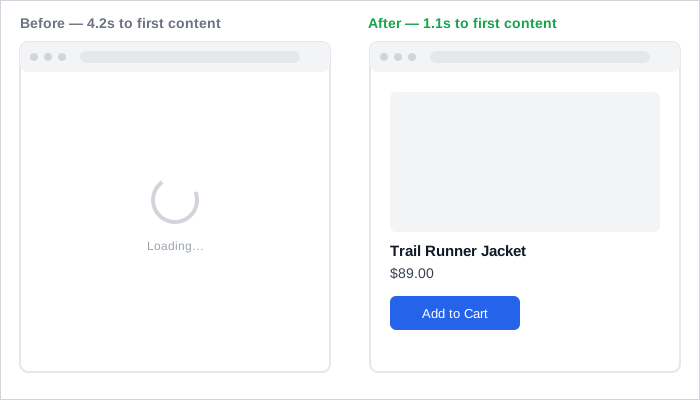 Same product, same page — the only difference is how long a visitor stares at a spinner before deciding whether to stay.
Background
The techniques below (see The Design of Sites: Pattern Group L — Speeding Up Your Site for their original source) predate modern measurement tooling, but two decades of real optimization work since then confirm the same underlying claim with far more precision: a faster page converts more visitors, not just a smoother-feeling one, and the gain typically shows up in revenue within days of shipping the change.
a faster page converts more visitors, not just a smoother-feeling one, and the gain typically shows up in revenue within days of shipping the change.
Problem
A slow-loading page loses visitors before they ever see what it offers — patience runs out during the wait itself, not after, so load time functions as its own first-impression gate, independent of the content behind it.
A slow-loading page loses visitors before they ever see what it offers — patience runs out during the wait itself, not after, so load time functions as its own first-impression gate, independent of the content behind it.
Solution
Ground the case for speed in measurable business outcomes
Speed’s return on investment isn’t theoretical — a growing set of real optimization efforts each measured a business metric moving in step with a load-time change:
- Vodafone Italy — a 31% Largest Contentful Paint (LCP) improvement raised sales 8%, lead-to-visit conversion 15%, and cart-to-visit conversion 11%.
- Rakuten 24 — JavaScript/image optimization and layout-shift fixes raised revenue per visitor 53%, conversion rate 33%, and average order value 15%.
- Renault — across 10 million visits in 33 countries, each 1-second LCP improvement correlated with 13% more conversions and a 14-percentage-point drop in bounce rate.
- Deloitte Digital’s cross-industry study (37 brands, 30 million sessions) found a 0.1-second mobile speed improvement raised retail conversion 8.4% and lead-generation form submissions 21.6%.
- redBus — cutting Interaction to Next Paint from roughly 900ms to 350ms raised sales 7%.
- Netzwelt and Agrofy saw, respectively, 18% more ad revenue and a drop in load-abandonment from 3.8% to 0.9%, from broader Core Web Vitals work.
- Mozilla — a 2.2-second reduction in Firefox’s own download-page load time raised download conversions 15.4% (p = 0.000051).
See web.dev: Core Web Vitals Business-Impact Case Studies and Mozilla Metrics: Firefox Download Page Speed, Part II for the full set, including two mobile-specific cases covered separately under Mobile-First Design; both draw on the broader Business Impact Cases (compiled research spreadsheet) research compilation.
Cut the number and weight of files
Every additional file — a script, a stylesheet, an image — costs a separate round trip before the page can finish rendering, so fewer files means a faster page independent of any single file’s own size. Where an image is unavoidable, choose the format and compression level for its actual content (a photograph compresses well as JPEG; flat-color graphics compress better as GIF or PNG, or as an SVG when the content is genuinely vector-shaped) and crop or shrink it to the size the page actually displays, rather than serving a larger image and scaling it down in HTML.
Split large pages so the top renders before the rest
A single large block of markup forces the browser to receive the whole thing before it can render any of it. Splitting a long page’s content into smaller, independently-rendering pieces — historically, breaking one large HTML table into several smaller ones; in current practice, avoiding table-based layout for this purpose entirely (see Grid Layout) — lets the top of the page appear to a visitor while the rest is still arriving.
Prefer native HTML markup over images
Text rendered as an image costs a separate file request and can’t be selected, searched, or resized the way real HTML text can. Use actual HTML text styled with CSS wherever the content is text, reserving images for content that genuinely needs to be a picture.
Let the browser reuse what it already cached
Reusing the same image file across multiple pages — a logo, an icon, a repeated background — means the browser downloads it once and reuses the cached copy on every later page, except the very first page a visitor loads, which never benefits from a cache that hasn’t been populated yet. See Homepage Portal for why that exception matters most on exactly the page most visitors see first.
Manage perceived speed, not just measured speed
A customer’s patience depends on what they see happening, not only on the actual elapsed time. A progress indicator — a static message, an animated indicator, a thermometer, or progressively displaying content as it arrives — can make an identical wait feel shorter, but only if it stays accurate: a thermometer that misreports progress reads worse than showing no indicator at all. See Loading States for choosing among these indicators, and Interface Design Principles‘s feedback principle for the general case this is one instance of.
a thermometer that misreports progress reads worse than showing no indicator at all.
Meet Core Web Vitals’ fixed pass/fail thresholds
Modern measurement (Core Web Vitals) tracks more than time-to-first-content, and Google publishes a fixed target for each of its three metrics: Largest Contentful Paint (LCP) within 2.5 seconds, Interaction to Next Paint (INP) under 200 milliseconds, and Cumulative Layout Shift (CLS) under 0.1. CLS measures how much content visibly jumps around as a page finishes rendering, which frustrates and disorients a visitor even on a page that technically loaded fast. iCook’s 15% CLS improvement — reserving fixed-size ad slots instead of letting them resize once content arrived — raised ad revenue 10% on its own, without touching raw load time at all.
Related Concepts
Patterns
- Homepage Portal
- Above the Fold
- Grid Layout
- Mobile Screen Sizing
- Responsive Web Design
- Loading States
Principles
Further reading
Pinterest engineers’ Driving User Growth With Performance Improvements (medium.com/pinterest-engineering — no stated license) is a further worked example of the same page-speed-to-conversion link: a 2016–2017 performance rewrite cut Pinner wait time 40% while raising signup conversion and SEO traffic each 15%.
Sources
The Design of Sites: Pattern Group L — Speeding Up Your Site is this page’s original pattern source — the L1–L6 techniques for file count/weight, page splitting, native markup, caching, and perceived speed.
web.dev: Core Web Vitals Business-Impact Case Studies (CC BY 4.0) supplies most of the case-study numbers above: Vodafone, Rakuten, Renault, Deloitte Digital, redBus, Netzwelt, Agrofy, and iCook.
Mozilla Metrics: Firefox Download Page Speed, Part II (CC BY-SA 3.0) is the source of the Firefox download-conversion statistic.
Core Web Vitals (Google Search Central) (CC BY 4.0) supplies the fixed LCP/INP/CLS pass/fail thresholds above.