
- Plan
- Explore
- Concept
- Evaluate
- Launch
Usability Evaluation Methods
Overview
Does a design or prototype actually meet its goals — and how would you know?
The “evaluate” step of Iterative Design: assessing whether a design or prototype meets its goals. Three complementary approaches are used in combination across a project’s lifecycle, not as substitutes for one another. Concretely, all three are checking a design against the same five qualities — learnability, efficiency, memorability, errors, and satisfaction — that Usability Engineering names as what usability testing exists to measure.
Three complementary approaches are used in combination across a project’s lifecycle, not as substitutes for one another.
Expert reviews (heuristic evaluation)
Three to five expert judges independently review a site against a list of usability heuristics or principles (Jakob Nielsen‘s ten heuristics, or the seven principles in Interface Design Principles work equally well), often guided by sample tasks. See Heuristic Evaluation for the full method — its origin, evaluator-role tradeoffs, and other named heuristic sets. Each judge logs heuristic violations, proposes a fix, and rates severity by expected customer impact and frequency. Judges then merge their lists and reconcile severity ratings — research shows different experts surface different problems, so using several judges finds more of them; fewer, more expert judges are needed if they’re highly experienced (three is enough for true experts; five or six if using available team members instead).
Strengths: cheap, fast (hours, not days), good at catching potential usability catastrophes and subtle issues (e.g. poor color choice) that user testing might miss. Works better on high-fidelity prototypes than low-fidelity ones, since inexperienced judges tend to fixate on what’s visibly missing from a rough prototype rather than evaluating what’s there.
Caveats: experts can be miscalibrated relative to real customers — either more sophisticated (missing things that would trip up an average customer) or lacking domain knowledge a specialized audience would have. The technique also tends to surface false positives — violations flagged by judges that never turn out to be real problems in actual customer testing — so treating heuristic findings as ground truth risks misallocating design/engineering effort.
The technique also tends to surface false positives — violations flagged by judges that never turn out to be real problems in actual customer testing — so treating heuristic findings as ground truth risks misallocating design/engineering effort.
Informal evaluations
Recruit 5–10 people representative of target customers, give them a prototype (a paper prototype is fine — have them point/tap as they would click), ask them to perform tasks drawn from a task analysis, and observe. Participants are asked to think aloud (the think-aloud or verbal protocol) — narrate what they’re thinking as they work — prompted as needed (“what are you looking for now?”).
The data collected is qualitative process data: an overall sense of what works and what doesn’t, both from what people say and what they actually do. Watch for critical incidents (confusion, negative reactions, swearing) as candidates for redesign, and positive incidents (things going smoothly) as cues for design ideas worth reusing elsewhere. This method is not suited to claiming one design is quantifiably better than another or to timing how long actions take — only formal studies (below) support that kind of claim. After addressing found problems, rerun with a fresh set of participants to check the fix worked.
A practical session for this kind of evaluation usually runs about an hour, in three parts: an introduction to build rapport and surface relevant background, scenario-based tasks where the participant thinks aloud while looking for information, and a debrief asking neutral follow-up questions about specific words or phrasing that tripped them up. A good scenario gives a believable reason to look for something rather than asking for it directly (e.g. “you have a private pilot’s license and just moved to a new city — find out if you need to tell the FAA about your new address”).
Participants can be recruited informally — colleagues, friends, family — as long as they aren’t on the team that built what’s being tested, and no special approval is needed to run a small-group test like this.
An even faster, cheaper cousin is guerrilla testing (also called hallway testing or pop-up research): short, informal interviews conducted in public spaces frequented by likely users, used early in a design process for quick directional feedback. It’s a form of convenience sampling, so results can be biased toward whoever happened to be available and willing — useful for an early gut check, but it needs pairing with one of the other two methods rather than standing alone.
Testing doesn’t require being in the same room as participants, either: remote testing separates evaluator and participant in space and/or time, either synchronously (moderated, via video call or screen-sharing) or asynchronously (unmoderated, with interactions auto-logged for later review). Beyond convenience, remote testing improves access for participants who’d otherwise be excluded by mobility limitations, illness, disability, or transportation constraints — directly mitigating the disability-underrepresentation problem noted below.
Formal usability studies
Once a running prototype exists, formal studies collect quantitative bottom-line data — hard numerical metrics tested for statistical significance rather than read off a handful of sessions. Useful for simple, repeatable comparisons (e.g. does moving a button left vs. right change completion time?) and for comparing two competing interface designs head to head — in Web design this head-to-head comparison has a standard name, A/B testing (or split testing): two versions, identical except for one variable, compared on an outcome of interest like click-through or conversion rate (multivariate or bucket testing extends this to more than two versions at once). This is the same technique Web Site Development Process documents under the name “virtual testing,” credited there to Amazon.com and Google. Can run with as few as 10 participants, though numerical/statistical goals generally need more. Online usability-testing services can recruit and run much larger samples (50–200 participants) quickly, which matters because a small sample only uncovers a small fraction of potential problems when a site’s customer base has very diverse goals and behavior (a finding attributed to the consulting firm User Interface Engineering). As with informal evaluation, errors must be explicitly defined in advance and agreed on by the team, since something like a “return to homepage” event is ambiguous without a stated definition.
Standardized instruments: SUS, NPS, and NASA-TLX
Where A/B testing compares two designs against each other, the System Usability Scale (SUS) gives a single design a portable satisfaction score. SUS is a ten-item questionnaire, alternating positively- and negatively-worded statements (“I think that I would like to use this system frequently” / “I found the system unnecessarily complex”) rated on a five-point agreement scale. Responses are combined through a fixed formula into a single 0–100 score, which makes SUS one of the few instruments that supports comparing usability across outwardly dissimilar systems — at the cost of being a single, fairly general number rather than a diagnosis of which part of the system is the problem. Subsequent analysis (Lewis & Sauro) found the ten items actually load onto two correlated sub-scores, Usability and Learnability, which can be reported separately when that distinction matters. Because it’s quick to administer and score, SUS is typically added to a formal study alongside the bottom-line behavioral metrics above, as the subjective-satisfaction half of the picture — behavioral metrics show whether people completed the task; SUS shows how they felt about it.
The Net Promoter Score (NPS) measures a related but distinct construct — customer loyalty rather than perceived usability — from a single question (“how likely are you to recommend this to a friend or colleague?”) scored 0–10. Respondents split into promoters (9–10), passives (7–8), and detractors (0–6); the score is the percentage of promoters minus the percentage of detractors, reported as a plain integer. NPS is widely adopted in industry for its simplicity, but it measures the product or brand relationship as a whole, not any single interface or task — so unlike SUS it isn’t a substitute for testing a specific design, and it doesn’t diagnose why a score is low. It also carries real methodological criticism: academic research disputes whether “likelihood to recommend” actually predicts growth better than other loyalty questions, and the 0–10/promoter-detractor cutoffs discard information from passive respondents. NPS is best read as a business-level loyalty tracking metric to watch over time alongside — not instead of — the task-level and satisfaction measures above.
NASA-TLX measures a third, distinct construct — subjective workload rather than usability or loyalty — from six rating subscales combined into one weighted-average score. Like SUS, it’s typically added to a formal study as a subjective self-report alongside behavioral metrics, but it targets a different question: not how usable the system felt, but how much mental and physical effort completing the task actually cost the participant — the more useful measure when the task itself is inherently demanding (a cockpit, a control room) rather than merely unfamiliar.
How many participants is enough?
Jakob Nielsen’s claim that testing five users per round is enough — echoing this page’s own 5–10-person range for informal evaluation, above — has both a formal backing and a formal critique. The backing: the Nielsen-Landauer formula, U = 1 − (1 − p)ⁿ, models the proportion of problems found (U) as a function of each user’s per-problem detection probability (p) and the number of users tested (n) — an asymptotic curve where each added participant finds proportionally fewer new problems. The critique: real testing shows wide variance around that curve — groups of five found 85% of problems on average, but as few as 55% in some runs, while no group of twenty found below 95% — because the formula assumes a constant detection probability that doesn’t hold for subtle, severe problems, which are systematically harder to find and need larger samples. In practice this argues for the same conclusion this page already reaches independently: don’t treat a single small-sample round as final, and re-test after each fix with a fresh group.
In practice this argues for the same conclusion this page already reaches independently: don’t treat a single small-sample round as final, and re-test after each fix with a fresh group.
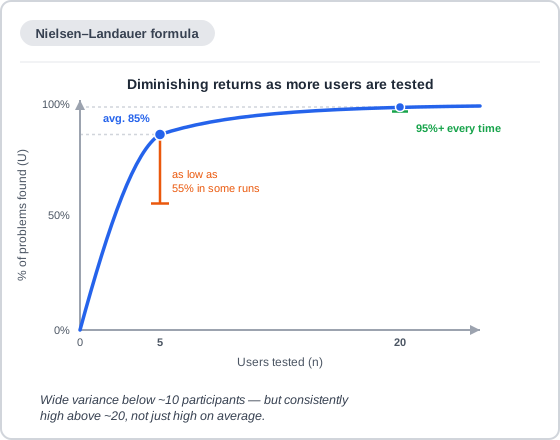 The average curve looks reassuring at n=5 — the whisker is what shows why Nielsen’s critics don’t stop there.
Sampling limitations
Whoever gets recruited for testing shapes which problems get found, and two systemic gaps recur across all three methods above: underrepresentation of users with disabilities (the WHO estimates 1.3 billion people — 16% of the global population — experience significant disability, yet recruitment and stakeholder-culture barriers routinely exclude this group from testing, even though accessible design depends on testing with the people it’s meant to serve), and WEIRD sampling bias (Western, Educated, Industrialized, Rich, Democratic populations are roughly 12% of the world but some 96% of published behavioral-science research participants — and cognitive/perceptual processes are shown to vary by culture, so findings from a WEIRD-only sample may not generalize). Remote testing (above) helps with the first gap by removing some physical/logistical recruitment barriers, but doesn’t on its own fix the second.
A faster variant: RITE
The RITE method (Rapid Iterative Testing and Evaluation, see Usability Engineering) fixes a problem and tests the fix on the very next participant within the same study, rather than waiting for a full round of testing to finish before changing anything — trading some methodological cleanliness for speed when a problem is severe and obvious enough that confirming it across the whole planned sample first adds little.
Choose a technique
Use all three, balanced by cost and project stage rather than choosing one. Expert review and informal evaluation are run continuously while iterating, especially early, to surface and fix basic design flaws using qualitative process data; formal studies are run as a site matures, closer to or after deployment, to get hard numbers and to make a stronger case to stakeholders (e.g. management or marketing) who may need more than five-to-ten-participant findings to be convinced a change is warranted. These three methods are exactly what get applied during Web Site Development Process‘s own Discovery (evaluating the existing site and competitors) and Exploration/Refinement phases (testing each round of prototypes).
Related Concepts
Principles
Processes
- Iterative Design
- Customer Research Methods
- Rapid Prototyping
- Web Site Development Process
- Usability Engineering
- NASA-TLX
- A/B Testing
- Task Analysis
- Heuristic Evaluation
- GOMS
Further reading
Steve Krug’s Don’t Make Me Think, Revisited (3rd edition, amazon.com/dp/0321965515 — commercially published, no stated open license) is a widely-read practitioner’s case for exactly the kind of lightweight, frequent informal testing described above under “Informal evaluations,” down to Krug’s own well-known framing that testing one person is always better than testing none.
Sources
The Design of Sites: Ch. 4 — Involving Customers with Iterative Design is the source for the three-way division into expert reviews, informal evaluations, and formal usability studies, and for treating them as complementary techniques run across a project’s lifecycle rather than substitutes for one another.
Usability Testing (Digital.gov Plain Language Guide) supplies the hour-long session structure (introduction, task scenarios, debrief), the recruiting guidance, and the FAA-pilot-relocation scenario example used in “Informal evaluations.”
Usability Engineering (Wikipedia) is the source for the RITE method described in “A faster variant: RITE.”
Usability Testing (Wikipedia) supplies the guerrilla-testing and remote-testing descriptions, and the “Sampling limitations” section’s WHO disability-prevalence figure and WEIRD-sampling-bias finding.
System Usability Scale (Wikipedia) is the source for the SUS description — the ten-item alternating-polarity questionnaire, its scoring formula, and the Lewis & Sauro Usability/Learnability sub-score finding.
Net Promoter Score (Wikipedia) is the source for the NPS description — its single-question methodology, promoter/passive/detractor scoring, and the academic criticism of its predictive validity.